All right. You've dug up some existing information on your customers and organized it in a rudimentary way. What now?
Let's say your initial research has given you some insights into part of the customer journey right around the conversion or purchase point.
But prior to that, the customer awareness and decision phases are something of a hazy mystery.
To fill in those gaps, you're going to do some primary research, collecting information directly from your potential customers about their thoughts and actions during those stages.
Here are three main ways you could do that.
Live interviews.
With the interview method, you question users or customers, either in person or over the phone to learn all about their experiences and decisions during the relevant phases of the customer journey.
The advantage of this kind of ethnographic research is that you can go into detail, asking about a customer's thoughts, feelings, and actions.
The responses you receive will allow you to adjust your follow-up questions.
The disadvantages? Well you're relying entirely on your subjects' memory and honesty. That's risky.
Also confronted with a live interviewer, even people with good recall may subconsciously give you the answers they believe you want to hear. This is acquiescence bias.
Diary studies.
In this research method, you pay customers to record their thoughts, feelings, and actions throughout their customer journey in a diary.
This largely eliminates the problem of faulty recall. The disadvantages that it requires considerable diligence on the part of the customer.
They have to take the time to write down their observations and actions at every touch point. And that's likely to come at a pretty steep cost.
Direct observation.
With direct observation, you follow your customers, documenting their actions and movements yourself. It's a little like stalking them.
These direct observations of customers can be made in two ways. We like to call them IRL and URL. IRL stands for In Real Life and URL. . . It stands for Online.
In real-life direct observation, an observer you hire actually follows individual customers as they push their buggies through the supermarket aisles or browse the shelves of their favorite shoe store and records everything they do.
Yes, it's entirely legal and these shopper stalkers are very discreet. They look like just another average shopper. But, in fact, they are astute observers of customer behavior.
When you track the movement and choices of customers who are shopping online, well, then you're doing user testing. And, it just so happens we have an entire video series on that very subject.
For user testing, you can either look over your subject's shoulder using a video camera to record their words and actions--even their eye movements--as well as whatever is on their computer or phone screen at the time.
Alternatively, you can use applications like Hotjar or Crazy Egg to track their clicks and cursor movements remotely.
The advantage of these direct observation methods is that they're more accurate. You see what your subjects are actually doing, or have done, from moment to moment, as opposed to their "sometimes" questionable recall of events.
The disadvantage of direct observation is that you can only infer what customers are thinking and feeling as you track them.
But to get around this problem, you can supplement your tracking with what's called contextual inquiry, asking users questions while they shop for or use products.
And again, this can be expensive. So where do you find customers willing to participate in these surveys or tracking methods?
Well, you can solicit participants through email campaigns, social media platforms, or through signup forms posted on your website.
There are online services that will assist you in recruiting users like Ethnio and User Interviews Dot Com.
This is where you're going to have to spend a few dollars. It's fine to ask people a couple of questions in a form for a warranty. And you could even post an optional survey on your website to glean some free info. But the kind of detailed information needed for customer journey mapping?
Well, people expect to be compensated for that. We'll provide some links in the video notes for recruiting sources.
Just how many participants you'll need to recruit for qualitative studies--well, that's a tricky question. Most studies invoke the principle of saturation to determine the number of interviewees.
This means they'll recruit subjects until they stop hearing any new observations or opinions in response to their questions, which is not very scientific.
Practically speaking, your sample size is going to be limited by your budget, but five is generally considered a minimum.
The next step is to supplement your qualitative findings with quantitative data.
You could follow up your interviews with surveys to measure the frequency or degree of any of the behaviors you've uncovered.
For example, let's say your interviews revealed two users who complained that having to give their credit card number before knowing the shipping costs was annoying.
A survey asking users how much they concur with that idea on a scale of one to five could quantify just what percentage of users share that opinion. Then you know if this is a common sentiment or just an outlier complaint.
Now this brings up an interesting point. While having a satisfied customer is very important, what you really want are paying customers or other conversions. We'll be exploring this idea in more depth in a supplementary video, linked below.
Use web analytics to verify qualitative findings.
Use website analytics to correlate events like purchase abandonment with pain points you've identified. You can even follow that with a further round of survey questions to see if those correlations hold up.
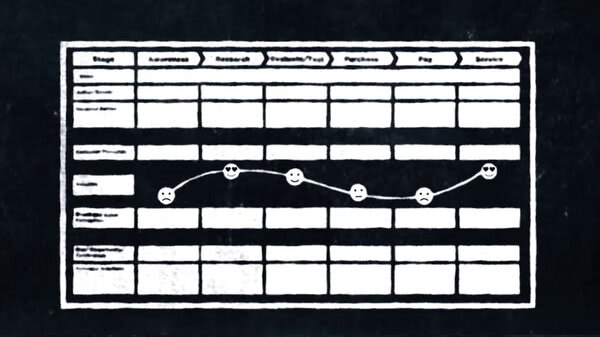
If you've designed your interviews and observational sessions well, you should be able to now have gathered enough data to help fill in some of the remaining blanks in your customer journey matrix.
At this point, it should look something like this: Okay, not bad. We haven't filled in all the blanks, but by this time each phase of the journey has at least a couple of customer decisions, questions, feelings, pain points, or influences.
We have enough information to piece it together in graphical form -- hopefully something more interesting than just a matrix of squares.
In fact, there are likely some phases in here that you have far more data than you can fit. Now, sketch out your map using whatever design you've chosen.
Again, feel free to download our template using the link below.
The particular form you choose for your map will depend largely on the questions you're asking and the problem you're attempting to solve.
To rough out a quick example, suppose you're trying to improve your customers' experience with over-the-phone product returns.
You want to streamline the process and lower frustration levels. You could create a map with an expanded use and advocacy phase in which you track your user satisfaction.
Touch points include searching your website for the number to call, waiting for an agent to answer and reaction to the agent suggested remedy for the problem. Keep in mind. That's just one answer to one question.
Once you've completed this draft of your map, then you go back to doing more primary research to fill in whatever blanks remain. At this point, it will be highly targeted interviews.
Finally, presentation is important.
You spent considerable time and money collecting the best data you can find. So don't skimp on the design. If you don't have access to in-house designers, we'll go outside and find one to work with.
Come up with a map that is colorful and eye catching. Yes, you should have a rough idea of how you want your map to look going in, but a designer will offer good creative alternatives or at least be able to riff off your original concept.
This can be the most creative part of mapping the customer journey. A map that is visually engaging is more likely to be referenced and studied. And that brings us to our next video, in which we ask, what do you do with your map once it's finished?