So you've conducted your usability study. You've given your testers tasks and probed their minds with incisive questions. Congrats! It's time to assess your hard won results.
A good first step is to watch whatever screen recordings you've made of users performing their assigned tasks. Make a bowl of popcorn, put up your feet and watch the playback.
Listen to the test subjects' audio commentaries. Pause to make notes, but maybe not too often the first time through. Doing this should give you a good idea of the overall tenor and quality of your test users' experiences. It will also familiarize yourself with their individual voices, which may be helpful later when analyzing their answers.
Pause the playback to note places where your testers appear to have stalled or gotten lost. But also take note of anything they particularly enjoyed or appreciated. If everybody loves something, you want to take care to preserve it.
Because there's no irritation like seeing some beloved feature eliminated from your favorite piece of software. Take note of outlier responses to tasks.
Are these people clueless? Or, just the opposite, especially perceptive? It might be that these deviations present avenues for further investigation.
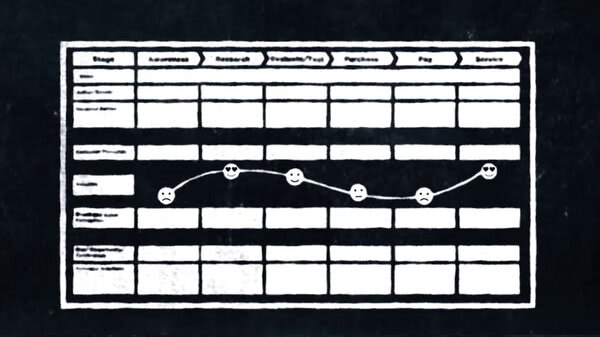
Consider using a spreadsheet to tabulate your results. This will allow you to quickly survey responses and help you spot trends in the data. It's great to be able to sort answers according to whatever criteria you choose.
Finally, you'll want to share your findings with your team members and, ultimately, all of the stakeholders. That's another good reason to compile the results in a spreadsheet.
Other ways you can share your findings? Well, you could compile a list of best quotes from your sessions.
Create a highlight reel from the test recordings, bolstering your recommendations.
You can create graphs or charts to illustrate your findings. Even if there aren't that many testers, it could still be helpful in spotting trends. And as always, check with your original objectives when presenting to stakeholders. They'll want to know that you are addressing the issues that brought them to you in the first place.